


Using the Debugger
Step-by-Step
- From the
Debugmenu, select theStart Debuggingmenu item. Some extra fields will be shown. - Type ;. The Keystroke log will show
;. The display to the right has two sections. The upper section shows the characters displayed on the screen. The lower section shows a table of characters and their Unicode values. Here the upper section will show;and the lower section will show;andU+003B. (U+003B is the Unicode value for “;”.) - Type e. The Keystroke log will show
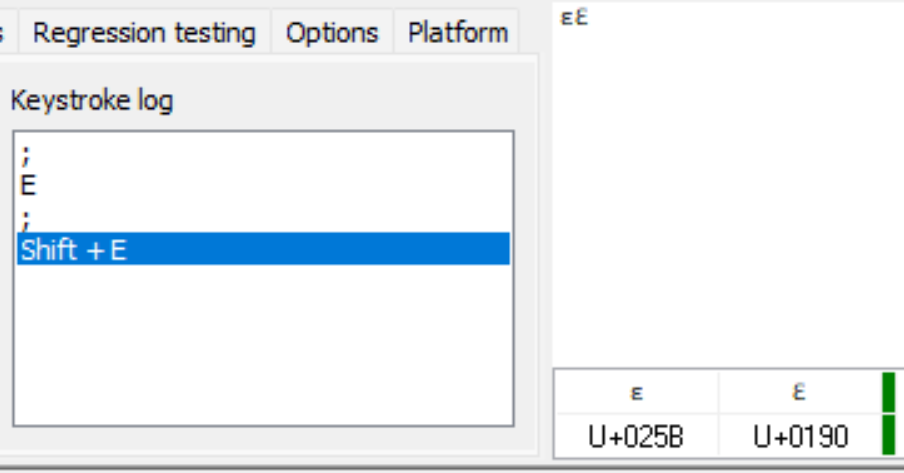
;andE. The display to the right will showɛin the upper section andɛandU+025Bin the lower section. (U+025B is the Unicode value for “ɛ”.) - Type ; then E. The Keystroke log will show
;E;Shift+E. The display to the right will showɛƐin the upper section andɛandU+025BthenƐandU+0190in the lower section.
- From the
Debugmenu, select theStop Debuggermenu item.
Running the Debugger
See the debugger documentation for more information on running the debugger.